


True electrograms* with
EnSite™ Omnipolar Technology
The EnSite™ OT Near Field Mapping Solution consists of the following components:
EnSite™ OT Near Field Technology:
A next-generation mapping capability within the EnSite™ X EP System, designed to enhance signal fidelity and spatial resolution. It enables clinicians to visualize true near-field signals improving confidence in substrate identification and ablation targeting.
Advisor™ HD Grid X Mapping Catheter, Sensor Enabled™:
This advanced catheter features a grid-pattern electrode layout and magnetic sensors for high-density mapping. When used with EnSite™ OT Near Field, it delivers precise, orientation-independent signals and supports complex arrhythmia procedures with improved accuracy and speed1.
EnSite™ X EP System:
The open-architecture platform that powers EnSite™ OT Near Field. It supports multimodal mapping, integrates with various catheter types, and provides real-time visualization for both atrial and ventricular procedures. The system is designed for flexibility, enabling tailored workflows and reduced fluoroscopy exposure2,3.
EnSite™ OT NF Clinical Studies
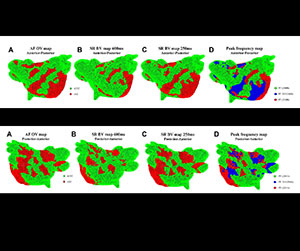
Peak frequency can be effectively used to characterize scar in atrial fibrillation
PF mapping effectively differentiated between nLVZs (non-low voltage zone), fixed remodeling, and functional remodeling sites. A PF between 215 and 236 Hz was highly predictive of functional remodeling. Thereby, the combination of Omnipolar Voltage and PF measurements in AF will more accurately allow the characterization of the substrate in AF.
Efficacy of the peak frequency map for left atrial posterior wall isolation
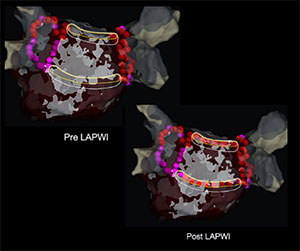
In this study, the position of linear ablation of posterior wall was determined based on anatomic (group 1) or Peak Frequency-determined (group 2) locations. The success rate of the LA roof block line targeting the high PF areas was significantly better than that of the conventional anatomical approach. Using a PF map for determining the optimal ablation line for LAPWI is feasible and may increase the probability of completing LAPWI without excess applications within the LAPW.
In the combined activation timing and peak frequency emphasis group, the number of ablation points required for successful isolation of the PV was significantly lower than in the activation group. The emphasis map enabled objective highlighting of the reconnection sites and facilitated the visual recognition with less unnecessary ablation applications.
The novel automated PF algorithm complements established mapping criteria and holds the potential to enhance the accuracy of LA mapping during AF ablation. The cutoff values were determined for bipolar and omnipolar voltages and Peak frequency at conduction gaps were as follows: Bipolar 0.20mV and 190.25Hz; Omnipolar 0.32mV and 222.8Hz. Utilizing PF, as opposed to voltage criteria, proves to be more effective in identifying residual activity along circumferential PV ablation lines during AF ablation procedures.
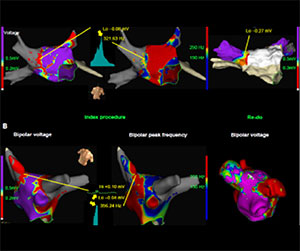
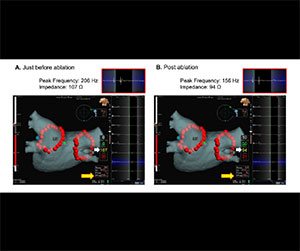
This study demonstrates a novel intraprocedural parameter, PF drop, for predicting the acute phase PV gap following PVI. PF maps in patients with a PV gap were analyzed; areas PV gap demonstrated significantly lower PF drop and higher PF post ablation than areas without a gap (-14 ± 43 Hz vs. 61 ± 57 Hz, p < 0.001; 226 ± 49 Hz vs. 176 ± 47 Hz, p < 0.001). The PF drop had the highest predictive value for PV gap among the significant parameters, with a cutoff value of 10.5 Hz, which may be a useful monitoring marker to achieve a durable lesion during PVI.
Peak Frequency Analysis Distinguishes Nearfield from Farfield Signals during Pulmonary Vein Isolation
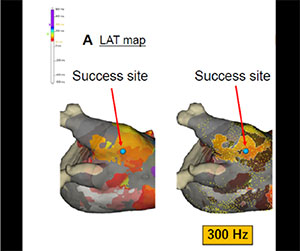
PF was lower in far-field electrograms than nearfield electrograms. A PF cutoff was selected in an initial cohort and validated in two following cohorts of PAF and PersAF patients. A PF cutoff of 300 Hz had a sensitivity of 93.2% (selection cohort), 90.0% (PAF validation cohort) and 98.6% (PersAF validation cohort), with an overall specificity of 100%. PF analysis improves the recognition of PV isolation.
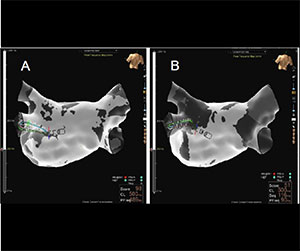
In this case, a threshold PF value of 200 Hz was the optimal cutoff for the localization of the residual conduction gap. However, the optimal cutoff PF value may differ depending on various factors.
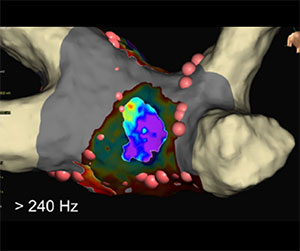
Far-field versus near-field frequencies at apparent versus true critical site of PV gap. 28 gaps were found and gap regions showed significantly higher PF. PF better detects residual conduction within an atrial scar region than conventional bipolar voltage. The PF cutoff value for gap discrimination in the PV antra is 240 Hz.
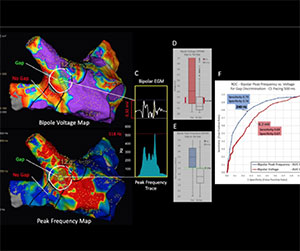
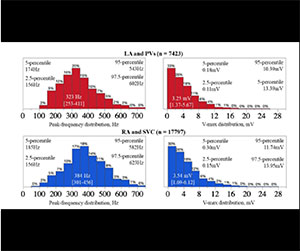
Generally, the median peak frequency was significantly higher in the PVs than in the LA (346 [253–441] Hz vs. 323 [262–397] Hz) and in the SVC compared to the RA. Since the timing of the activation of musculatures far from the electrodes, producing far-field electrograms, and the timing of that just below the electrode, producing near-field electrograms, are different, the entire electrograms become fractionated.
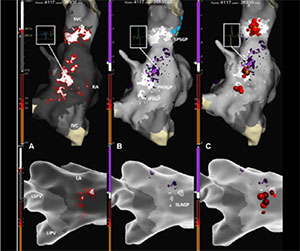
Cardioneuroablation guided by real-time spectral analysis: The Omnipolar Technology Near Field
OTNF with PF allows fast and accurate visualization of high frequency atrial areas on a high-density electroanatomic map. This tool may help electrophysiologists to selectively target GPs in the setting of a CNA procedure, avoiding imprecise or over-extensive ablation.
The peak EGM frequency at the VT critical site is a strong predictor of VT recurrence (AUC = 0.81). Notably, the peak frequency at the critical site, as annotated using the Nearfield algorithm, was significantly lower in patients with recurrence compared to those without (192 Hz vs. 397 Hz).
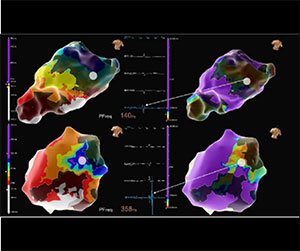
All areas of VT termination were located in a low voltage and high peak frequency zone. PF mapping apparently identifies slow conduction isthmus and provides complementary information to voltage mapping which can be displayed with emphasis on the electranatomical map.
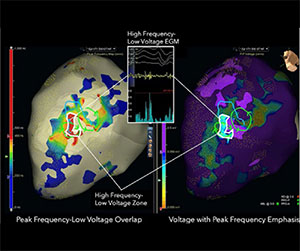
PF 220 Hz predicted areas of LAVA, late potential, and deceleration zones targeted for ablation in nearly all cases performed by experienced, high-volume operators. Acquisition of successful ablation targets would have broad implications for patient safety, procedural efficiency, procedural availability, and reimbursement.
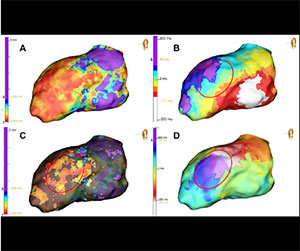
High-frequency near-field EGMs (405 Hz) during VT reflect vulnerable areas inside slow conduction isthmus sites. Targeting this area is an independent predictor of rapid VT termination. Areas of frequency >220 Hz within the scar detected during voltage mapping showed a correlation to deceleration zones. Based on our study, EGM PF >405 Hz is a valuable predictor of VT interruption.
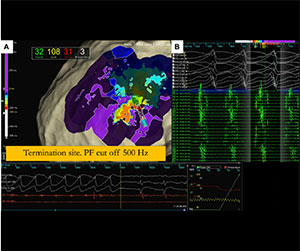
The OTNF algorithm with PF cutoff >220 Hz was applied to a retrospective cohort of 25 patients who underwent VT ablation and ILAM using the standard offset of the latest local bipolar electrogram.The PF technique is fully automated and therefore readily can be used by electrophysiology laboratories broadly and may decrease procedural times as a result of reduced need for manual reannotation.

Detailed Analysis of Electrogram Peak Frequency to guide Ventricular Tachycardia Substrate Mapping
Identification of critical components of the VT isthmus is feasible using substrate-based PF maps to highlight relevant low voltage with an optimal PF threshold of ≥200Hz. Low voltage substrate-based PF mapping during sinus rhythm may identify the critical VT isthmus more accurately than RV pacing. Chronic amiodarone exposure was associated with a lower PF in the isthmus zone during PF mapping of VT.
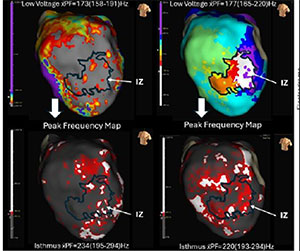
In substrate maps, use of the Nearfiled detection algorithm results in statistically significantly smaller late activating areas compared to last deflection detection and less frequently identified deceleration zones co-locating with the VT isthmus area. For activation maps of scar-related reentry VTs, NF detection allows rapid identification of the VT isthmus without manual reannotation.
PF analysis of the fragmented potentials allowed selection of the site for RF energy application. Clinical ventricular tachycardia was no longer induced during electrophysiological study after ablation.
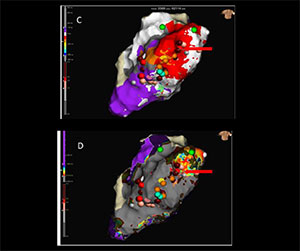
The nearfield detection algorithm represents the timing of the activation on the endocardial surface. The first component of the EGM at the earliest activation site may reflect a far-field recording from the site of origin. A novel delta first deflection-to-peak frequency electrogram index may predict rapid successful endocardial ablation of outflow tract arrhythmias.
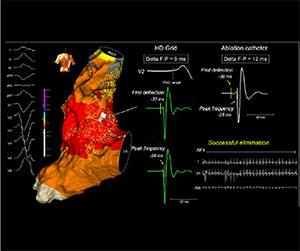
Peak frequency distributions differed significantly across myocardium conditions. The median peak frequency was 120.0 Hz (77.3–179.0 Hz) in normal voltage myocardium, 145.0 Hz (100.0–194.3 Hz) in low voltage myocardium without late potentials (LPs), and 291.0 Hz (190.3–380.3 Hz) in low-voltage myocardium with late potentials (LPs). In normal voltage areas, no significant differences in PF values were observed between sinus rhythm and RV pacing. These findings suggest that pacing does not significantly alter PF characteristics in either normal or low voltage regions.
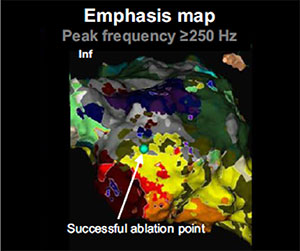
The successful ablation site had high peak frequencies (≥ 250 Hz), indicating near-field potentials.
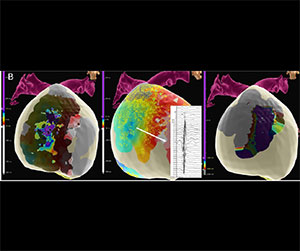
Peak frequency mapping in Brugada Syndrome
After ajmaline perfusion, high-density epicardial mapping was performed using the Advisor™ HD Grid Catheter. In addition to LAT and voltage maps, a peak frequency map was obtained. Radiofrequency ablation was performed on the area of late and low-frequency potentials. Remapping after ablation, also under ajmaline, revealed elimination of late potentials on LAT map and elimination of type 1 Brugada pattern. Curiously, although voltage remained above 1.5 mV, no low-frequency areas were highlighted on the map.
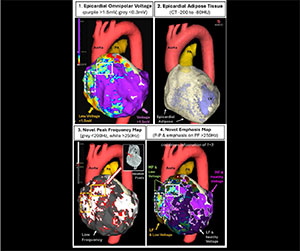
On epicardial maps, low PF values may indicate far-field signals and could indirectly support the identification of sites with epicardial adipose tissue. Semiautomated imaging of epicardial adipose tissue using ADAS is shown as a reference to establish the anatomical epicardial adipose tissue pattern and demonstrates reasonable agreement with the PF map.
Identification of the slow AV nodal pathway by low frequency mapping
A late activation low frequency area of mean 0.92 cm2 was found in 18 out of 20 patients. The slow nodal pathway is often located in an area of late activation and low frequency. The mean PF at this area was 175.5 Hz which was significantly lower than the PF recorded at the adjacent atrial area 279.71 Hz.
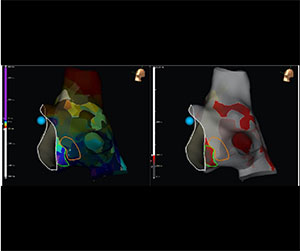
Among quantitative variables, the optimal discriminatory performance for successful Slow Pathway identification was observed using bipolar voltage restricted to a peak frequency >340 Hz (AUC=0.75).
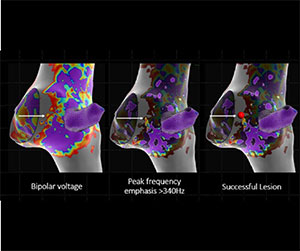
The high-frequency site of the Tricuspid Valve of the 4–5 o’clock position in the peak frequency map could be a novel target of slow pathway ablation with high safety, efficiency, and efficacy. This peak frequency map–guided approach may help facilitate RF applications with a lower risk of AV block.
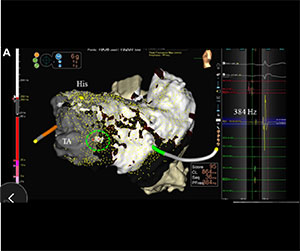
The successful ablation sites in this study displayed relatively low peak frequencies, primarily in the range of 180–210 Hz regardless of the rhythm.
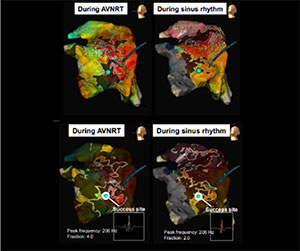
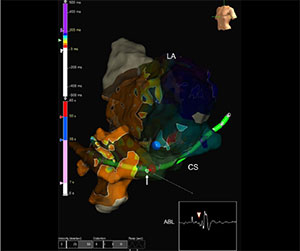
This novel mapping algorithm for peak frequency analysis of an electrogram using OTNF may be useful for identifying the precise location of the Kent bundle.
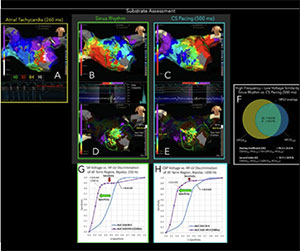
Paired sinus rhythm (SR) and 500 ms CS paced (CSP) maps were acquired before ablation. High frequency-low voltage CSP discriminated termination region with AUC 0.82 vs. AUC 0.61 based upon Voltage CSP alone. HFLV mapping during either SR or CSP improves specificity to detect the macroreentant atrial arrhythmia with slow conduction zones compared to voltage mapping alone.
PF values at termination sites were significantly higher than global PF values and PF within the 5-mm termination diameter. PF values above 363 Hz differentiated global atrial PF from isthmus regions, with values >530 Hz indicating maximum PF at termination sites corresponding to the critical isthmus. Dynamic adjustment of the PF window in each patient allowed best to display regions of maximum PF and to identify the critical isthmus area.
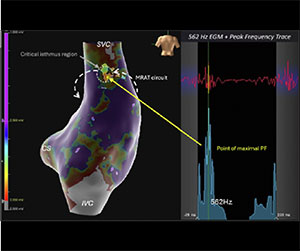
By increasing the emphasis map slider value of the PF from 200 Hz to 550 Hz, the authors could distinctly visualize and identify the critical isthmus of the complex AT circuit and evaluate the PV gap, leading to minimal RF applications to treat these tachycardias.
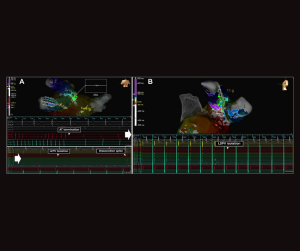
The high frequency-low voltage regions correlated well with deceleration zones of ILAM as well as with the successful ablation sites of ATs.
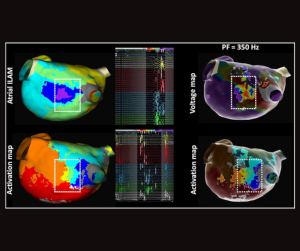
Peak frequency mapping of atypical atrial flutter
All local termination site data had mean PF >150 Hz. 10 of 12 local termination sites (83%) had mean PF >250 Hz, with only 3 of 12 measuring mean PF >350 Hz. 9 of 12 patients (75%) had significantly higher PF near the termination site (all p <.05), and 89% of these sites had significantly lower mean voltage or voltage <0.5mV. PF provides a method of better characterizing and distinguishing critical low-voltage areas.
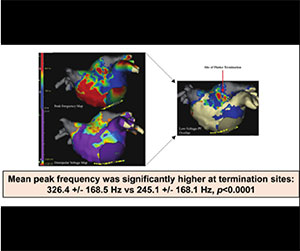
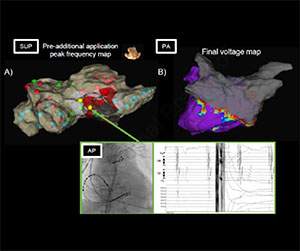
Peak Frequency (PF) maps were serially obtained with prior to PFA, throughout PFA application series, and post-PFA. PFA was intentionally delivered at areas of high PF to achieve PVI. This one-shot PF-guided PFA map before each application was related to the lesion formation and may indicate the tissue contact level of the catheter electrodes. This information may improve the durability and achievement of assured block line formation.
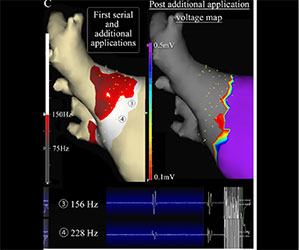
High PF could indicate areas of thinner atrial myocardium or fewer epicardial bundles. Therefore, applying PFA at sites with high pre-application PF appears to particularly make sense for PWI. The analysis of these three cases indicates that 200 Hz may serve as a robust cutoff value.
References
- Kapa, S., et al. (2026, April). Quantifying performance of high-density mapping catheters in in-vivo and benchtop models[Poster presentation]. European Heart Rhythm Association (EHRA) 2026 Congress, Paris, France.
- Fiorenzo Gaita, Peter G. Guerra. Alberto Battaglia, Matteo Anselmino (2016). The Dream of near-zero X-Rays ablation comes True. European Heart Journal, Volume 37, Issue 36, 21 September 2016.
- Chen, H. et al. (2023). Circumferential pulmonary vein isolation with vs without additional low-voltage-area ablation in older patients with paroxysmal atrial fibrillation. JAMA Cardiology, 8(8), 76 https://doi.org/10.1001/jamacardio.2023.1749.



MAT-2631239 v1.0
Important Safety Information
Rx Only. Brief Summary: Prior to using these devices, please review the Instructions for Use for a complete listing of indications, contraindications, warnings, precautions, potential adverse events, and directions for use.
United States: Required Safety Information
Indications: The EnSite™ X EP System is a suggested diagnostic tool in patients for whom electrophysiology studies have been indicated. The EnSite™ X EP System provides information about the electrical activity of the heart and displays catheter location during conventional electrophysiological (EP) procedures. Warnings: For patient safety, any connections that directly connect the patient to the EnSite™ X EP System must be routed through the appropriate modules: EnSite™ X EP System SurfaceLink Module, EnSite™ X EP System 20 pin Catheter Input Module, EnSite™ X EP System 80-pin Catheter Input Module and Direct Connect Ports on the EnSite™ X EP System Amplifier. When using the EnSite™ X EP System, full protection against the effects of cardiac defibrillator discharge and other leakage currents is dependent upon the use of appropriate cables. Refer to the ablation catheter IFU for a listing of adverse events related to the use of this device in conjunction with ablation, as a part of the diagnosis and treatment of cardiac arrhythmias. Non-SE catheters cannot collect location data and should not be used for navigation in VoXel Mode because they do not have a magnetic sensor. However, they can be visualized and display intracardiac signals. Only connect items that have been specified as part of the EnSite X EP System or compatible with the EnSite X EP System to the multiple socket-outlets. The EnSite™ X EP System model display should be used in conjunction with conventional EP techniques to confirm catheter location. The AutoMark feature does not indicate lesion effectiveness. AutoMarks are placed based on user-defined parameters for catheter stability and RF metrics only. PFA AutoMarks are placed based on electrode location and user-defined PFA metrics only. Sudden impedance changes of the body or catheter electrodes caused by the connection of other devices (e.g., stimulator, defibrillator, and other devices) may create a location shift. The 2D and 3D LivePoint Displays should not be used as the primary / sole display of tissue proximity during an Electrophysiology study. Refer to the Current PFA Generator IFU for warnings related to the Volt ™ LivePoint Display. Precautions: For patient safety, any connections that directly connect the patient to the EnSite™ X EP System must be routed through the appropriate modules: EnSite™ X EP System SurfaceLink Module, EnSite™ X EP System 20 pin Catheter Input Module, EnSite™ X EP System 80-pin Catheter Input Module and Direct Connect Ports on the EnSite™ X EP System Amplifier. When using the EnSite™ X EP System, full protection against the effects of cardiac defibrillator discharge and other leakage currents is dependent upon the use of appropriate cables. Refer to the ablation catheter IFU for a listing of adverse events related to the use of this device in conjunction with ablation, as a part of the diagnosis and treatment of cardiac arrhythmias. Non-SE catheters cannot collect location data and should not be used for navigation in VoXel Mode because they do not have a magnetic sensor. However, they can be visualized and display intracardiac signals. Only connect items that have been specified as part of the EnSite X EP System or compatible with the EnSite X EP System to the multiple socket-outlets. The EnSite™ X EP System model display should be used in conjunction with conventional EP techniques to confirm catheter location. The AutoMark feature does not indicate lesion effectiveness. AutoMarks are placed based on user-defined parameters for catheter stability and RF metrics only. PFA AutoMarks are placed based on electrode location and user-defined PFA metrics only. Sudden impedance changes of the body or catheter electrodes caused by the connection of other devices (e.g., stimulator, defibrillator, and other devices) may create a location shift. The 2D and 3D LivePoint Displays should not be used as the primary / sole display of tissue proximity during an Electrophysiology study. Refer to the Current PFA Generator IFU for warnings related to the Volt ™ LivePoint Display.
Indications for Use: The Advisor™ HD Grid X Mapping Catheter, Sensor Enabled™, is indicated for multiple electrode electrophysiological mapping of cardiac structures in the heart, i.e., recording or stimulation only. This catheter is intended to obtain electrograms in the atrial and ventricular regions of the heart. Contraindications: The catheter is contraindicated for patients with prosthetic valves, and patients with left atrial thrombus or myxoma, or interatrial baffle or patch via transseptal approach. This device should not be used with patients with active systemic infections. Patients unable to receive heparin or an acceptable alternative to achieve adequate anticoagulation. Warnings: Persons with a known history of allergies to any of the materials listed below may suffer an allergic reaction to this device. Before use, counsel the patient on the materials contained in the device and discuss a thorough history of allergies. This device contains: Acrylonitrilebutadienestyrene (ABS Cycolac) – Loctite Adhesive – Pellethane – Platinum Iridium alloy – Polyimide – Polyether block amide (PEBAX) – Polyethylene (High Density Polyethylene, HDPE) – Titanium. Cardiac catheterization procedures present the potential for significant xray exposure, which can result in acute radiation injury as well as increased risk for somatic and genetic effects, to both patients and laboratory staff due to the xray beam intensity and duration of the fluoroscopic imaging. Careful consideration must therefore be given for the use of this catheter in pregnant women. The safety and effectiveness of the device has not been established in pregnant women or prepubescent children. Careful consideration must therefore be given for the use of the device in pregnant women or prepubescent children. Catheter entrapment within the heart or blood vessels is a possible complication of electrophysiology procedures. Vascular perforation or dissection is an inherent risk of any electrode placement. Careful catheter manipulation must be performed in order to avoid device component damage, thromboembolism, cerebrovascular accident, cardiac damage, perforation, pericardial effusion, or tamponade. Risks associated with electrical stimulation may include, but are not limited to, the induction of arrhythmias, such as atrial fibrillation (AF), ventricular tachycardia (VT) requiring cardioversion, and ventricular fibrillation (VF). Do not use force to advance or withdraw catheter when resistance is encountered. Do not immerse the proximal handle or cable connector in fluids; electrical performance could be affected. Precautions: Maintain an activated clotting time (ACT) of greater than 300 seconds at all times during use of the catheter. This includes when the catheter is used in the right side of the heart. To prevent entanglement with concomitantly used catheters, use care when using the catheter in the proximity of the other catheters. Maintain constant irrigation to prevent coagulation on the distal paddle. Inspect irrigation tubing for obstructions, such as kinks and air bubbles. If irrigation is interrupted, remove the catheter from the patient and inspect the catheter. Ensure that the irrigation ports are patent and flush the catheter prior to reinsertion. Use the straightener during the insertion process to avoid damage to the hemostasis valve. Always straighten the catheter before insertion or withdrawal. Catheter advancement must be performed under fluoroscopic guidance to minimize the risk of cardiac damage, perforation, or tamponade. Compatible navigation and real time visualization systems may also be considered. Do not use if the catheter appears damaged, kinked, or if there is difficulty in deflecting the distal section to achieve the desired curve. Catheter materials are not compatible with magnetic resonance imaging (MRI). One or more components of this device may contain the following substance defined as CMR 1B in a concentration above 0.1% weight by weight: Nmethyl2pyrrolidone (NMP): Chemical Abstracts Service (CAS) No. 872504; EC No. 2128281. Based on a quantitative toxicological assessment it has been determined that NMP released from this device is unlikely to cause adverse reproductive effects. Potential Adverse Events: Complications related to the use of the device include, but are not limited to, the following: New or worsening of existing arrhythmia including Atrial fibrillation, Ventricular tachycardia requiring cardioversion, Supraventricular tachycardia (SVT) and Ventricular fibrillation Cardiac perforation including Pericardial effusion or Cardiac tamponade Bleeding including access site Hemorrhage / bleeding, Ecchymosis and Hematoma Vascular access complications or peripheral vascular injury including Femoral artery dissection, Dissection, Arteriovenous fistula and Pseudoaneurysm formation Pulmonary vein stenosis, Heart failure, Volume overload, Hypotension, Embolism, Cerebrovascular accident (CVA)/stroke, Infection, Pneumonia, Pulmonary edema, Immunological reaction, Pain and Pericarditis.